Category: Development

  • Downtown Fremont in 2030: The Development Pipeline You Should Know About

    Downtown Fremont in 2030: The Development Pipeline You Should Know About

    Development

    Downtown Fremont in 2030: The Development Pipeline You Should Know About

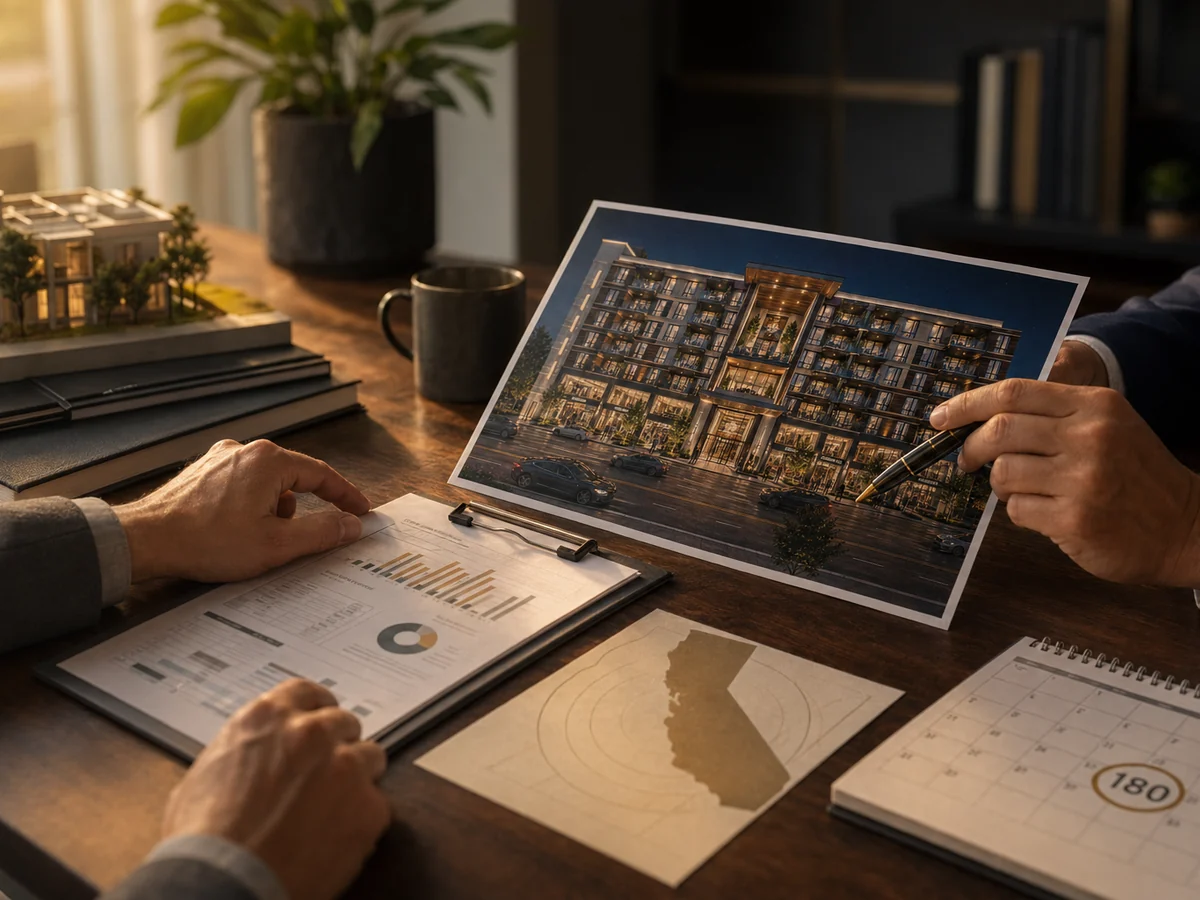
    A look at the projects actively reshaping downtown Fremont between 2026 and 2030 — Capitol 101, the downtown civic center expansion, and the Warm Springs innovation district.

    Downtown Fremont 2030 development pipeline

    Fremont’s downtown plan in context

    For most of its municipal history, Fremont did not have a downtown. The city was incorporated in 1956 by combining five older unincorporated communities — Centerville, Niles, Irvington, Mission San Jose, and Warm Springs — each with its own identity, main street, and commercial core. The resulting city had everything a modern suburb needed except a center. For decades, downtown Fremont was a concept on a planning map rather than a place on the ground.

    The Fremont Downtown Community Plan, adopted in various iterations since the late 1990s and meaningfully updated in the 2010s and again in the early 2020s, is the framework that has been slowly pushing that concept toward reality. The plan designates a specific geography along Capitol Avenue — roughly bounded by Mowry to the north, Paseo Padre to the south, and extending a few blocks east-west of Capitol — as the future downtown. It prescribes mixed-use zoning, minimum density requirements, ground-floor retail mandates, and an integrated public realm of plazas, improved streetscapes, and transit connections.

    For the first fifteen years after its adoption, the plan was mostly aspirational. For the last five, it has started to produce buildings. Between 2026 and 2030, more physical capital will be committed to downtown Fremont than in any prior five-year window — and the cumulative effect, by the end of the decade, will be a downtown that looks, feels, and functions meaningfully different from the one that existed at the start of 2025.

    What is under construction today

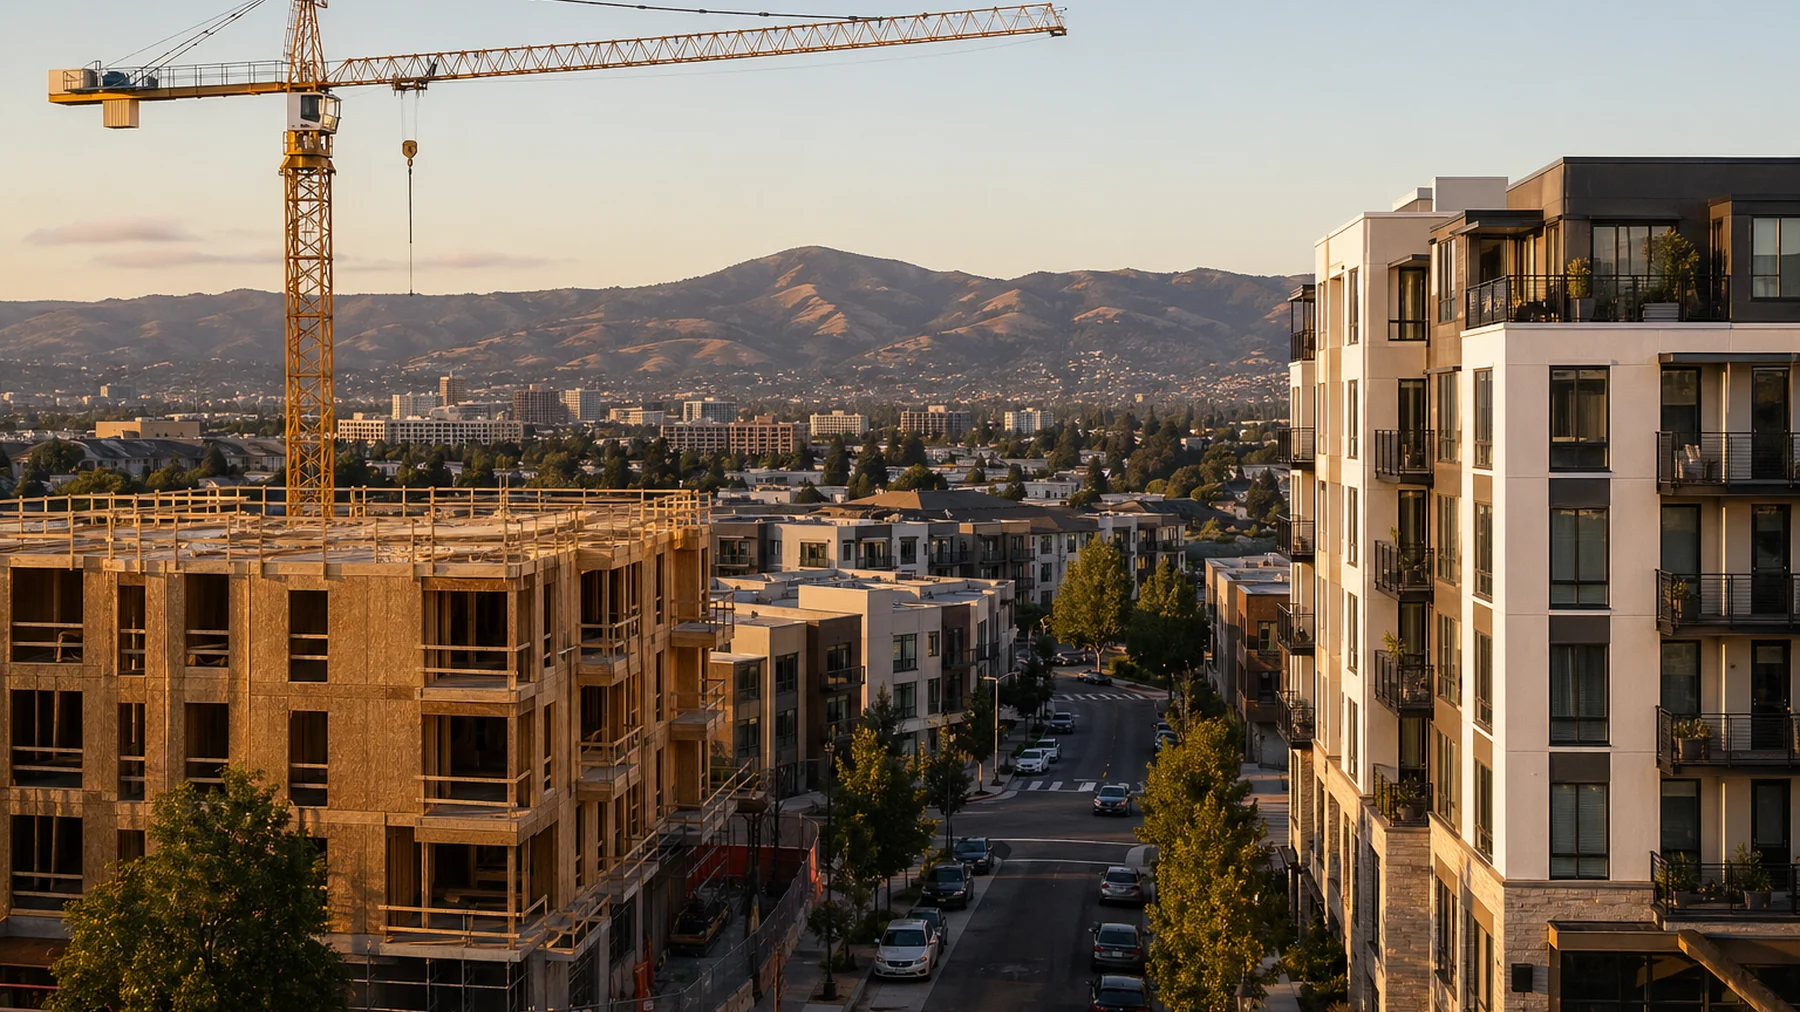
    At time of writing (April 2026), four major mixed-use projects are in active construction or in final entitlement within the downtown plan area. A mid-rise apartment project on Walnut has topped out and is targeting lease-up in late 2026. The Paseo Padre corridor is seeing two smaller mid-rises move through permitting, both in the 80 to 120 unit range. A larger downtown-core project — fronting Capitol Avenue itself — broke ground in early 2026 and is projected for delivery in 2028.

    Our own Capitol 101 sits inside this pipeline. 126 luxury apartments plus 14,000 square feet of ground-floor retail at 3411 Capitol Ave, currently in construction with stabilized delivery targeted for 2027-2028. The project’s location — three minutes to Fremont BART, one block from the Fremont Hub retail district, and directly on the Capitol Avenue spine — is not accidental. The downtown plan contemplates exactly this density at exactly this spot, and the entitlement track reflected that alignment.

    Downtown Fremont in 2030 will be denser than at any point in the city’s seventy-year history. The projects are permitted, financed, and in the ground — not speculative.

    The Capitol Avenue spine

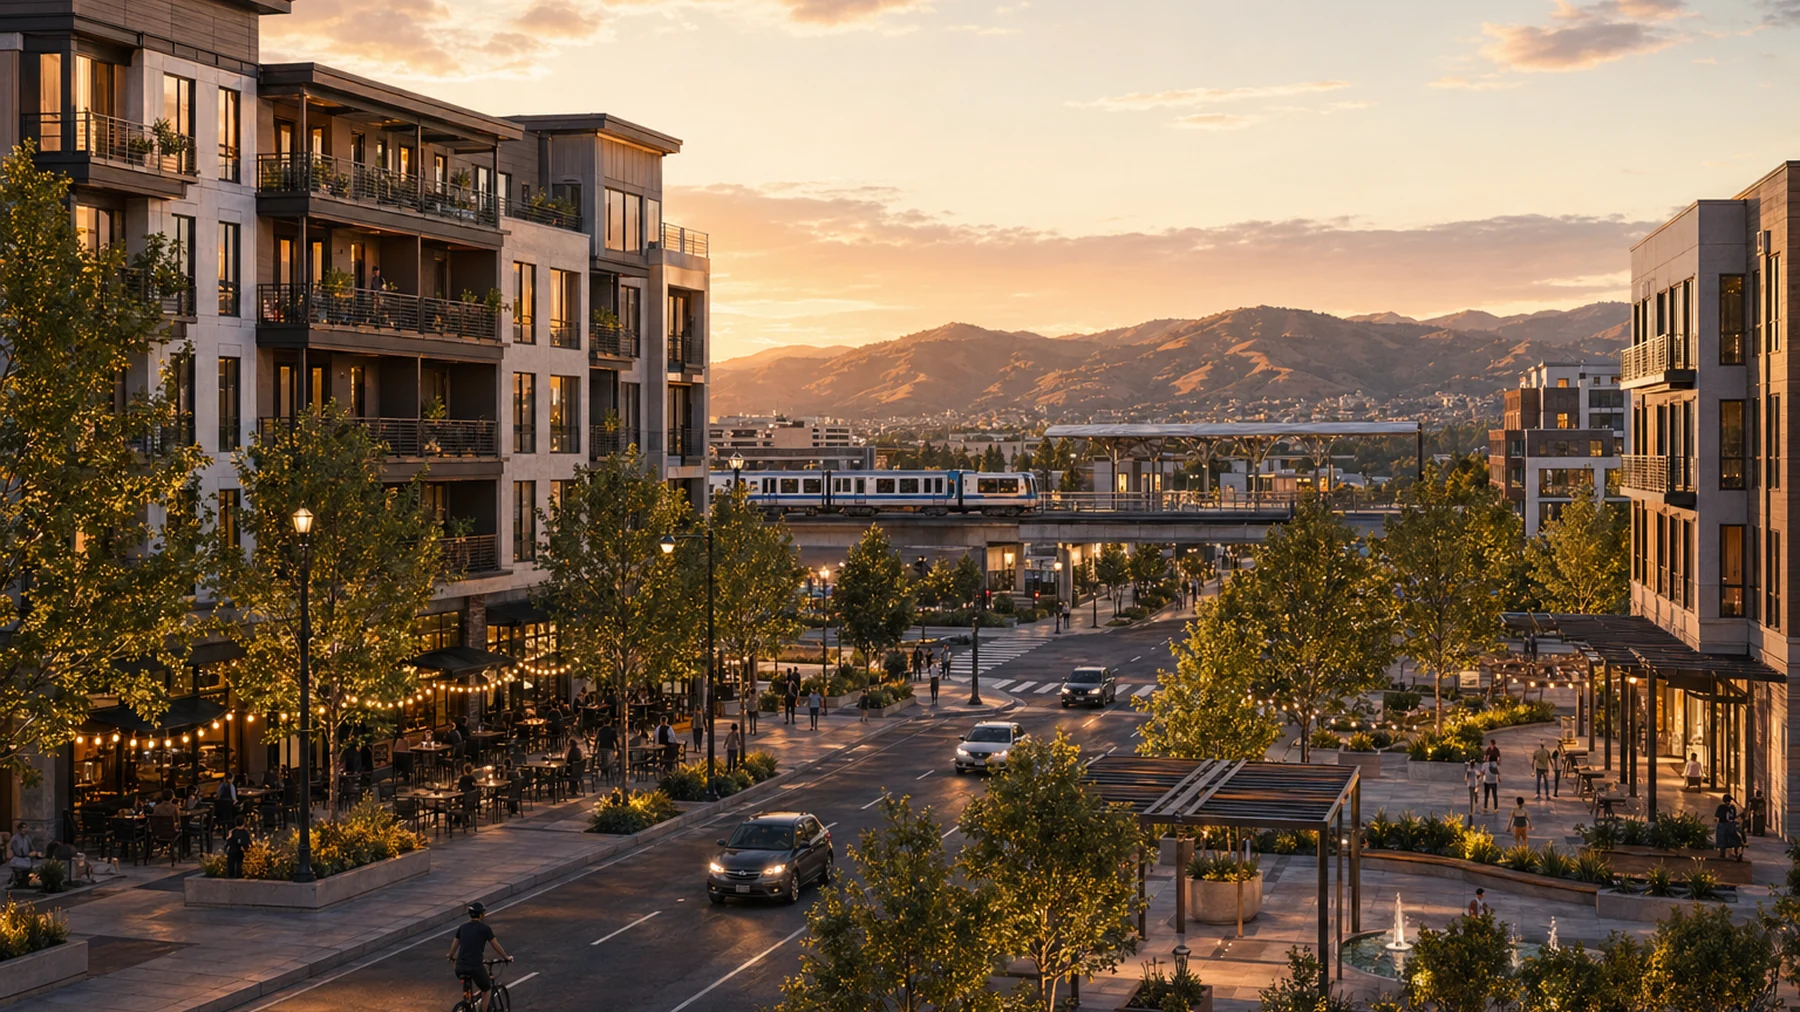
    If the downtown plan has a centerpiece, it is Capitol Avenue itself. The street is being transformed from a conventional four-lane arterial into a “complete street” with protected bike lanes, widened sidewalks, enhanced streetscape trees, pedestrian-scale lighting, and curbside loading bays that accommodate delivery vehicles without blocking the travel lanes. Phase one of this transformation — the block between Paseo Padre and Walnut — completed in 2024. Phase two is in construction through 2026. Phase three, extending the streetscape south past the BART connection corridor, is programmed for 2027-2028.

    The Capitol Avenue improvements matter for more than curb appeal. They are the physical substrate that makes mixed-use densification viable. A 126-unit apartment building with ground-floor retail needs a sidewalk you can walk on, a safe bike connection, and enough pedestrian activity to support the retail. The city is, in effect, building the public realm that will receive the private capital — and the private capital is arriving because it can see the public realm being built.

    Civic and public-realm upgrades

    The downtown civic presence has also been expanding. The Fremont Art and Education District — a clustered redevelopment anchored by an expanded community theater, upgraded library facilities, and a renovated civic plaza — is in phased implementation through 2028. The renovated Central Park, immediately adjacent to the downtown plan area, has been completed. The Fremont Main Library expansion was delivered in 2024 and has seen measurable increases in daily visitation.

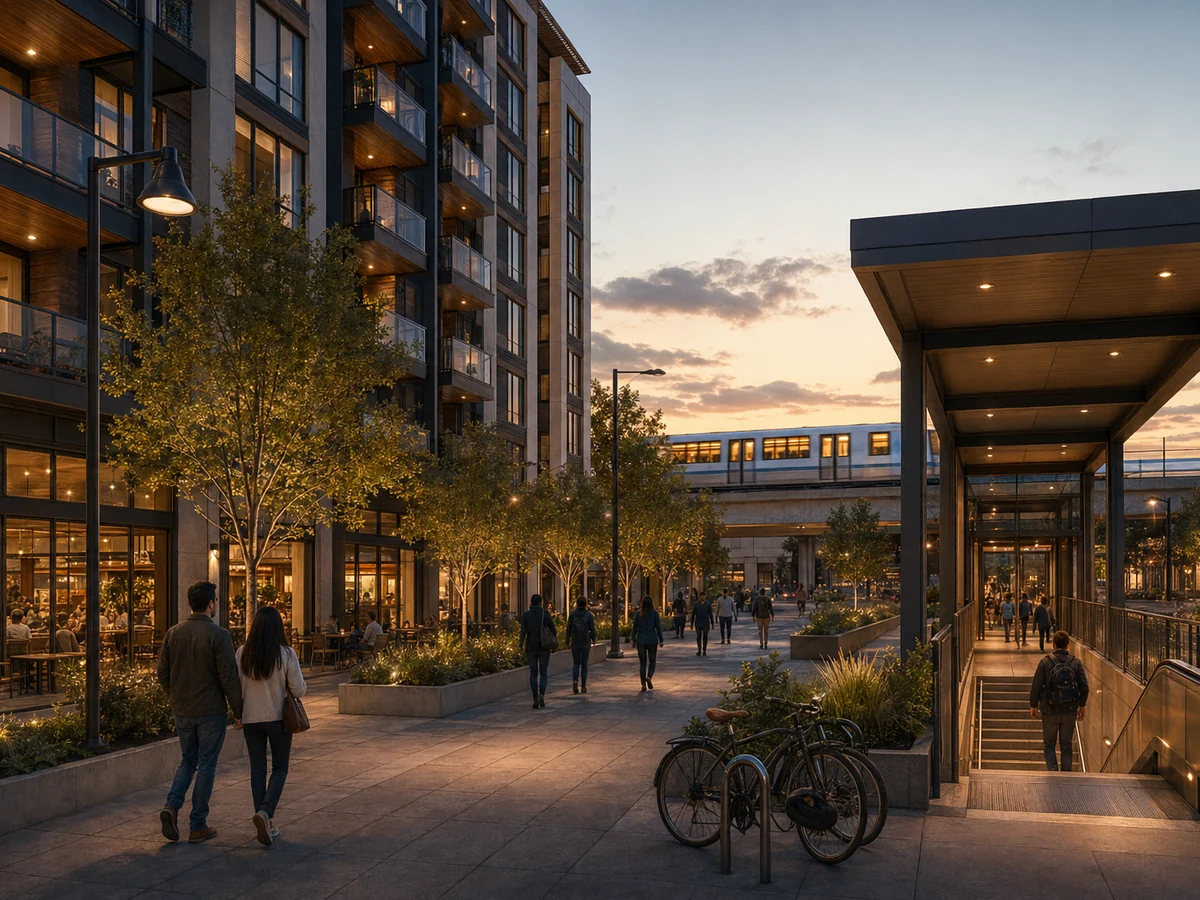
    A downtown, in the urban-design sense, is never just housing and retail. It is a public realm that accumulates reasons for people to come to it — a library, a theater, a plaza, a farmers’ market (the Fremont Sunday market has been growing). The cumulative effect of these upgrades is that downtown Fremont is, for the first time, a destination with a center of gravity.

    Warm Springs and the south downtown innovation district

    Fifteen minutes south of the downtown plan area, the Warm Springs/South Fremont BART station — the southernmost station on the Fremont line until the Berryessa extension opened — has anchored its own, larger-scale redevelopment. The Warm Springs Innovation District is an approximately 900-acre mixed-use master plan with a mix of new housing, commercial office, R&D space, and retail. Tesla’s Fremont factory sits at the northern edge of this district; several smaller manufacturing and technology tenants have located nearby.

    The Warm Springs build-out runs on a longer horizon than the downtown plan — full completion is a 2030s story, not a 2020s one — but the first wave of housing is delivering now. This matters for downtown because it creates a second employment and residential node within the city, connected to downtown by BART (five minutes on the train between stations) and by the Capitol Corridor rail link. A two-node Fremont, with downtown and Warm Springs both building density, is a more functional city than one with a single concentrated center — and it pulls rents and demand up in both nodes.

    Transit — BART, Capitol Corridor, and the new VTA link

    The transit equation is the reason the downtown plan penciled at all. Fremont BART connects downtown to San Francisco in 47 minutes (Embarcadero Station), to downtown Oakland in 30 minutes, and to the Berryessa/North San Jose line in 15 minutes. The Capitol Corridor regional rail stops at the Fremont Centerville station with service to Sacramento and the Central Valley. And the completion of the VTA BART extension to Berryessa in 2020 — with subsequent phases extending toward downtown San Jose — opened a southern connection that previously required a bus transfer.

    The practical effect: downtown Fremont in 2026 has four-direction regional transit connectivity — north to Oakland and the Peninsula, south to San Jose, east to the Tri-Valley and Central Valley, and west to San Francisco — that is genuinely rare outside of the region’s three primary downtowns. The development community has been pricing this in for the last several years. The state of California has been reinforcing it through SB 375, SB 9, and various Transit Priority Area (TPA) density bonuses that apply to parcels within half a mile of major transit. Capitol 101 is inside that TPA boundary, which permits higher density and provides a streamlined entitlement path the property would not otherwise enjoy.

    Rent trajectories and employer demand

    Rent data over the 2020-2025 period showed Fremont outperforming most East Bay submarkets on a percentage-change basis, though still trading at an absolute dollar discount to San Francisco, Oakland, and core Peninsula submarkets. The discount is the opportunity: a Class A one-bedroom apartment in downtown Fremont rents for meaningfully less than a comparable unit in San Jose or Oakland, despite the superior transit connectivity and the equivalent or better employer base within commuting distance.

    The employer base — Tesla manufacturing (approximately 20,000 jobs onsite), semiconductor and hardware companies distributed across Warm Springs and the Mission Boulevard corridor, the expanding Washington Hospital medical complex, and the secondary Silicon Valley employers who have pushed south from the Peninsula in search of lower-cost office — is remarkably diversified. Fremont’s employment is not concentrated in a single industry in the way, for instance, Mountain View’s is concentrated in one major tech employer. This diversification has historically dampened rent volatility in down cycles.

    Our underwriting for Capitol 101 assumes rent growth in the 2.5% to 3.5% range over the stabilized holding period, which is consistent with but not more aggressive than the regional trend. The upside is that the transition of downtown Fremont from a suburb with a planning-document downtown to a functional mixed-use urban center could, over the full ten-year horizon, produce outsized rent growth as the absolute Fremont discount to comparable urban submarkets narrows. That is upside, not base case; we underwrite to the base case.

    The Fremont rent discount relative to comparable Bay Area urban submarkets is the opportunity. If the downtown plan executes, that discount narrows. If it does not, the base case still works.

    What could slow the plan

    Every urban plan has failure modes. The three most relevant for downtown Fremont: financing conditions, state legislative change, and construction cost inflation. Financing conditions — specifically, the cost of capital for mid-rise and high-rise mixed-use construction — have been elevated since 2022 and are the single most important external variable. Projects that penciled at 2021 construction loan rates do not necessarily pencil at 2025 rates; the pipeline as it stands has survived that repricing, but the next wave of projects will be sized to current capital costs, not prior ones.

    State legislative change cuts both ways. SB 9, SB 35, and the various streamlined-ministerial-approval provisions the legislature has adopted have all worked in favor of urban densification in transit-rich areas like downtown Fremont. A reversal of those provisions — or a new wave of local opposition that slows entitlement despite state framework support — could slow the downtown plan. The likelihood seems modest, but it is not zero.

    Construction cost inflation is the most operationally relevant risk. Labor and material costs in the Bay Area construction market have been elevated relative to the national average for most of the last decade. A sustained 10%+ year-over-year cost increase would push break-even rents above what the current renter population can pay, which would slow the next wave of projects. This is the single variable our pro formas stress most heavily.

    Downtown Fremont in 2030 will not look exactly like the plan documents. It never does. But it will be denser than the downtown of 2020, more connected, and more oriented around a walkable public realm. The projects are under construction. The capital is committed. The pipeline is real.

    For our active downtown project, see Capitol 101. For the full firm including our projects across the Bay Area and Central Valley, see our portfolio.

    Related

    Next step

    Capitol 101 sits inside this pipeline.

    126 luxury apartments plus 14,000 sq ft of ground-floor retail at 3411 Capitol Ave. Three minutes to BART; directly on the Capitol Avenue spine.

  • The Bay Area Housing Crunch and What 126 New Homes Mean for Fremont

    The Bay Area Housing Crunch and What 126 New Homes Mean for Fremont

    Development

    The Bay Area Housing Crunch and What 126 New Homes Mean for Fremont

    The Bay Area is short hundreds of thousands of homes. A look at what 126 new apartments in downtown Fremont — and 16 townhomes in Newark — add to the region’s housing supply.

    Bay Area housing shortage aerial view

    The region’s supply gap by the numbers

    Every Bay Area housing analysis starts in roughly the same place — a number that sounds too large to be real. California’s statewide housing deficit, as modeled by the state Department of Housing and Community Development and the Regional Housing Needs Assessment (RHNA) process, is measured in the hundreds of thousands of units. The nine-county Bay Area’s share of that deficit runs somewhere between 440,000 and 530,000 homes depending on the vintage of the estimate and the methodology. RHNA’s eighth-cycle allocation for the Bay Area called for more than 441,000 units by 2031, with jurisdictional targets that many local governments have acknowledged they are unlikely to hit without material changes to their permitting posture.

    What these numbers mean on the ground: the region has been underbuilding relative to job growth for roughly four decades. The consequences are priced into every rent roll and every for-sale transaction. Median rents in the Bay Area remain the highest in the United States. Median for-sale prices sit north of $1.3 million region-wide and above $1.6 million in the South Bay and parts of the Peninsula. A household earning the regional median income cannot afford a median-priced home without unusual support. A household earning twice the regional median often cannot either. This is the texture that every new unit of housing enters, and it is why the question “what does 126 new homes really do?” is worth asking honestly.

    Why the supply gap exists

    Three forces, stacked, explain the gap. Each of them is an independent problem, and none of them gets solved by the others.

    The first is zoning. Most of the Bay Area’s buildable land is zoned for single-family detached housing, at densities that cannot absorb the population the region hosts. Even in cities that have updated their general plans, the supply of parcels actually zoned for the density needed to close the gap has lagged the demand for those parcels by decades.

    The second is construction cost. Bay Area hard costs for a new multi-family building in 2026 run in the range of $450 to $700 per square foot, depending on construction type, location, and labor market. When you add soft costs, land, financing, and contingency, the all-in basis to deliver a Type V or Type IIIA wood-frame apartment building lands somewhere between $550 and $850 per square foot. Those numbers set a floor under achievable rents that excludes meaningful chunks of the housing market from new construction on a purely cost-recovery basis.

    The third is friction — the sum of entitlement timelines, CEQA review, community-meeting cycles, appeals, permit delays, and litigation that extends a project from conception to delivery. A well-located Bay Area multi-family project routinely runs four to seven years from site acquisition to occupancy. Each year of that timeline adds carrying cost, inflation, and execution risk, and each year effectively taxes the supply response.

    The Bay Area is not short on land and it is not short on capital. It is short on the simple permission to build at the density the region’s population already requires.

    What “transit-oriented” actually requires

    The phrase “transit-oriented development” is used loosely enough that it has lost most of its meaning. Every project near a highway off-ramp calls itself transit-oriented. The useful definition is narrower: housing within a walk, not a drive, of a high-frequency transit station, built at densities high enough for the transit system to move the resulting residents.

    That definition cuts most Bay Area sites out. A parcel five miles from BART is not transit-oriented, however well-located it might be. A parcel one block from BART, but zoned for four units to the acre, is not transit-oriented either — it cannot host the density the transit system is built to serve. The parcels that actually qualify are the ones that combine adjacent transit with permitted density, and those parcels are rarer than the regional housing conversation usually acknowledges.

    Downtown Fremont, along the Capitol Avenue spine, is one of the East Bay’s clearest examples of a corridor that does qualify. BART on one end, Capitol Corridor on the other, a city general plan that has been rezoning for mixed-use density for over a decade, and parcels that have been waiting for the capital and the political alignment to deliver. What the Fremont downtown plan does that many Bay Area plans do not is pair permitted density with reduced minimum-parking requirements near transit — which is the single change in local code that most reliably lets transit-adjacent housing actually be priced at a level renters can reach.

    Capitol 101 case study

    Capitol 101 is our 126-unit, 14,000-square-foot mixed-use project at 3411 Capitol Avenue in downtown Fremont. Seven floor plans, named for Fremont’s neighborhoods, range from studios to three-bedrooms. 14,000 square feet of ground-floor retail is intended for local operators — a café, a yoga studio, a specialty grocer, the kind of storefronts that actually get used in a transit-oriented walkable core rather than national credit tenants that end up dark after 6 p.m. LEED Silver target. Two levels of podium parking at a ratio that respects the transit access rather than ignoring it.

    126 units, by itself, does not solve the Bay Area’s housing deficit. The deficit is measured in the hundreds of thousands. But 126 units is not trivial either. A Capitol 101 absorbs roughly 250 to 350 people into a single building, near a BART station, at a density that would have required dozens of single-family parcels in the same city a generation ago. It is also the shape of the answer — it is what the replication pattern looks like when it gets built at scale.

    The other thing Capitol 101 does is establish a proof point. Lenders, local governments, other developers, and even neighbors calibrate their expectations from what has actually been delivered. A single successful mixed-use project in downtown Fremont makes the next mixed-use project in downtown Fremont easier to finance, approve, and lease. Supply unlocks supply — slowly, cumulatively, building by building.

    Filbert Villas as for-sale family housing

    The multi-family conversation dominates regional housing policy, but a substantial share of the gap is for-sale family housing — three and four-bedroom homes that working households with children can actually buy. That product has been harder to build than apartments in the Bay Area for the last twenty years, because the site requirements, the construction type, and the political economy of single-family-adjacent development all cut against it.

    Filbert Villas, our 16-townhome development in Newark, is the other half of our contribution to the supply question. Each home is a three-story, four-bedroom, three-and-a-half-bath, 2,200-square-foot attached residence with a two-car garage. The ground floor flex room works as a home office, a guest suite, an au pair room, or a multi-generational living space. The second-floor open-concept kitchen, dining, and great room is sized for the kind of family meals and homework routines that townhome buyers actually have. The third-floor primary suite gives the house a retreat. The site is a short drive to Newark schools, the Dumbarton Bridge, BART Fremont, and the Silicon Valley employment corridor.

    Sixteen homes is a smaller number than 126 apartments, and it serves a different buyer — a family ready to take on homeownership in a region where homeownership has become structurally difficult. What it does not do is replace the apartment supply. What it does do is provide a for-sale product at a scale and price point that, in Newark, has been genuinely missing.

    The supply the region needs is not one thing. It is a portfolio — apartments near transit, townhomes for families, senior housing, affordable units, market-rate units, condos, ADUs. Every project is a thin layer in a stack that together has to be much taller.

    Why developers are building less, not more

    The unintuitive fact about the last three years in the Bay Area multi-family market is that production has fallen, not risen, despite the intensity of the regional conversation about supply. The reasons are structural. Construction costs have not retreated from their 2022 peaks. Financing costs, with the Fed’s policy rate still elevated relative to the 2010s, raise the hurdle rate on every pro forma. Office-driven urban demand in San Francisco proper softened the multi-family underwriting assumption for a chunk of the region, even as the East Bay and South Bay remained resilient. And insurance costs — driven by wildfire exposure and reinsurance market conditions — have escalated the operating-expense line on every new project.

    The combination has pushed the marginal project out of feasibility. Deals that penciled in 2019 and 2021 do not pencil in 2026 on the same land basis. The result is that the projects that do get built are increasingly the projects with a structural advantage — well-located sites, favorable capital stacks, owner-operators with long holding periods, or tax-advantaged structures like Qualified Opportunity Zones. Projects without a structural advantage sit on the shelf, which is why the regional pipeline has thinned.

    What changes if SB 9 and state-level reform scale

    California’s state-level housing reforms over the last five years — SB 9 (lot-split and duplex by-right in single-family zones), SB 10 (up-zoning near transit by local option), AB 2011 (by-right multifamily on commercial corridors), and a rolling set of CEQA streamlining measures — are the most aggressive zoning preemption of local control in the state’s history. The early returns are mixed. SB 9 uptake in 2022-2024 was lower than reformers had hoped, partly because the economics of splitting a suburban lot and building two additional units are often marginal at current construction costs. AB 2011 has generated more substantive permit activity on commercial corridors, and the CEQA streamlining measures have begun to shave months off entitlement timelines for projects that qualify.

    If these measures scale — if local governments continue to update general plans to permit the density the state now requires, if construction costs stabilize, if interest rates normalize — the pipeline could recover meaningfully over the second half of the 2020s. That is a conditional sentence stacked on three other conditional sentences, and we are not in the business of predicting any of them. What we can do is build the projects that make sense today, in the jurisdictions where permitting actually works, and add the supply the region needs one hundred and twenty-six units at a time.

    If you want to see the architectural and investor detail of the specific projects we’re delivering, Capitol 101 and Filbert Villas have the full public-facing specifications. If you want to read more about why the Fremont submarket in particular makes sense for new supply, our piece on BART-adjacent development goes further on that thesis. 126 homes does not close the gap. It is one hundred and twenty-six households who have somewhere to live, next to the transit they need, built by people who will still own and operate the building in 2040. At the scale the region requires, we need a lot more of that. We are building what we can.

    Related

    Next step

    See the homes we’re building.

    126 luxury apartments in downtown Fremont. 16 townhomes in Newark. Two projects, one region, a shared answer to the supply question.