Cap Rate vs Yield on Cost: How Developers Actually Price New Construction
A primer on the difference between cap rate and yield on cost — the two metrics that drive new-construction underwriting — with a Capitol 101 worked example.

Two metrics. One real deal.
Walk into any real estate underwriting meeting for a new-construction project and you will hear two numbers referenced in quick succession: cap rate and yield on cost. They sound like near-synonyms. They are not. The difference between them drives how a project is priced, how equity is raised, and whether the developer-investor relationship ends with a handshake or a lawsuit. Most investors in new-construction deals encounter both numbers and treat them as interchangeable. That mistake is the single most common source of confusion between sponsors and LPs in ground-up development.
This is a short primer. By the end, you should be able to read a development memorandum, tell the two metrics apart, and ask the questions that separate a well-structured project from a marketing package.
Cap rate, defined
Capitalization rate — cap rate — is the ratio of a property's annual net operating income (NOI) to its market value at a point in time. Expressed as a percentage, it is the yield a buyer would earn on the purchase price in year one if the deal were all-cash. A property generating $1 million of NOI and selling for $20 million transacts at a 5.0% cap rate. The lower the cap rate, the more the buyer is paying per dollar of income — which, perhaps counterintuitively, is a sign of perceived quality. Class A apartments in San Francisco trade at cap rates in the low 4% range. Tertiary-market industrial trades in the mid-7% range. The difference is the market's verdict on risk, growth, and durability of cash flow.
Cap rate is a stabilized-property metric. It is used to price acquisitions, to underwrite refinancings, and — critically for developers — to estimate the exit value of a completed project at stabilization. If a developer expects Capitol 101 to generate $7.57 million of stabilized NOI, and comparable Bay Area Class A multi-family assets trade at exit cap rates between 4.5% and 4.75%, the developer can derive an exit value: $7.57M divided by 4.50% is $168M; divided by 4.75% is $159M. That range is the stabilized value of the building, which is what the refinance lender will underwrite and what a potential buyer in year five or year seven will pay.
Yield on cost, defined
Yield on cost (sometimes called development yield) is the ratio of stabilized NOI to total development cost — land plus hard costs plus soft costs plus financing costs plus reserves. If a project costs $98.4 million all-in and generates $7.57 million of stabilized NOI, the yield on cost is 7.69%.
The critical conceptual shift: cap rate uses the price someone pays for a finished building; yield on cost uses what it cost to build the building in the first place. In a market where comparable buildings are trading at 4.50%, a developer who can build a new building at a 7.69% yield on cost has created substantial value simply by completing the project — assuming they can actually sell or refinance at the market cap rate when they are done.
Cap rate is what the market charges. Yield on cost is what the developer earns. The gap between them is the reason ground-up real estate development exists as a business.
The development spread — why the two metrics matter together
The gap between yield on cost and the prevailing exit cap rate is what developers call the "development spread." It is the single most important number in ground-up underwriting. A project with a yield on cost of 7.69% exiting into a 4.50% cap rate market has a spread of 319 basis points. That spread, multiplied by the stabilized NOI and capitalized back against the cost basis, is the profit the development is expected to create.
Do the math on Capitol 101. Total development cost of roughly $98.4M creates a building generating $7.57M of stabilized NOI. Capitalized at a 4.50% exit cap rate, the stabilized value is $168M. Subtract the cost basis: $168M minus $98.4M is $69.6M of created value, before financing costs and promote splits. Capitalized at a 4.75% exit cap, stabilized value is $159M; created value falls to $60.6M. The sensitivity of the outcome to a 25-basis-point change in exit cap is roughly $9M — which is why experienced developers underwrite a range, not a point estimate, and why lenders and LPs should too.
The development spread also tells you how forgiving a project is. A 319-basis-point spread absorbs cost overruns, schedule delays, and unexpected rent softness. A 150-basis-point spread does not; a project with a thin spread is one market shift away from marginal. In mid-2026 Bay Area multi-family development, spreads above 300 basis points are unusual and are a meaningful part of why projects like Capitol 101 are financeable at a time when many ground-up deals around the country are not.
When cap rate is the right lens
If you are buying an existing, stabilized, operating asset, cap rate is the metric. You are paying a price; that price implies a yield at current income; that yield compares against the alternative uses of your capital. The entire institutional acquisition market runs on cap rate. An investor looking at a core multi-family portfolio, a triple-net-leased retail strip, or a stabilized industrial warehouse is fundamentally a cap rate buyer.
Cap rate is also the right lens for evaluating exit assumptions in a development deal. A sponsor who assumes a 4.0% exit cap is making a much more aggressive bet than one who assumes 4.75%. When you read a development memorandum, find the exit cap assumption immediately; the bold number at the top of page one (the projected IRR) depends on an exit assumption buried on page seventeen. Test that assumption against current transaction comps, against prior-cycle ranges, and against the lender's underwriting cap rate, which is almost always more conservative than the equity sponsor's.
When yield on cost is the right lens
If you are financing or investing in ground-up construction, yield on cost is the metric. You are not buying a finished building; you are underwriting the construction of one. The cost basis is a known quantity; the eventual exit cap is a forecast. The yield on cost tells you what the finished building will earn against what it cost — before the market reprices it one way or the other.
Yield on cost is also the lens lenders use to size construction loans. A typical construction loan will permit up to 65% to 70% loan-to-cost, with the lender's underwriting constrained by a minimum yield-on-cost covenant (for example, the project yield on cost must exceed the going-in debt constant by some margin). A project that pencils at 6.5% yield on cost has less debt capacity than one that pencils at 7.5% — even if both projects project the same IRR — because the lender's protection rests on the yield the building will generate, not the IRR the equity expects.
A worked example — Capitol 101
Let us work through the numbers on our own active project. Capitol 101 is 126 luxury apartments plus 14,000 square feet of ground-floor retail at 3411 Capitol Ave in downtown Fremont. Stabilized projections from the project memorandum:
- Stabilized net operating income: approximately $7.57 million
- Total development cost (land, hard costs, soft costs, financing, reserves): approximately $98.4 million
- Yield on cost: $7.57M / $98.4M = 7.69%
- Exit cap rate assumption range: 4.50% to 4.75% (consistent with current Bay Area Class A multi-family trades)
- Implied stabilized value: $159M to $168M
- Development spread: 319 basis points at the low end of the cap range, 294 basis points at the high end
- Created value (gross of promote and financing): $60M to $70M
The project pencils because three things are simultaneously true: the yield on cost is in a range (7.5% to 8.0%) that represents a genuinely well-sited, well-priced development; the exit cap range is defensible based on recent transactions of comparable Bay Area assets; and the development spread is wide enough (roughly 300 basis points) to absorb reasonable cost variance and still deliver a meaningful return to equity.
Now run the sensitivity. If construction costs escalate by 10% — pushing the total cost basis to $108M — the yield on cost falls from 7.69% to 7.01%, and the development spread at a 4.75% exit cap compresses from 294 basis points to 226 basis points. The deal still works, but with noticeably less cushion. If exit caps widen by 50 basis points (to 5.25%) while costs hold, stabilized value falls to $144M, created value to $45M, and the project moves from "attractive" to "acceptable." This is the sensitivity investors should model before committing, and it is why any competent development memorandum will include a stress case, not just a base case.
Three questions to ask every development memo. What is the yield on cost? What is the exit cap assumption? And how wide is the spread if costs run 10% over and caps widen 50 basis points?
Why most investors conflate the two
The conflation usually happens in one direction: investors see a yield on cost and treat it as if it were a cap rate. "This deal is at a 7.69% cap" is a sentence we have heard investors say about our own projects. It is not — 7.69% is our yield on cost at our cost basis. A buyer of the stabilized building in year five will not pay a price that implies a 7.69% yield; they will pay a price that implies a yield in the low 4% range, consistent with the market for Bay Area Class A multi-family. The difference is the developer's return for having gotten the building built. An investor who understands the two metrics understands why new-construction LP equity can earn substantially more than stabilized-core LP equity in the same geography — and also why new-construction equity is substantially more exposed to construction, lease-up, and cap rate risk.
The two metrics are not complicated. But keeping them straight is the difference between reading an investment memorandum and understanding it. For the Capitol 101 project page with the full project details, see here; for the broader investment firm and the four vehicles we use to access it, our investor overview is the starting point.
Related

Qualified Opportunity Zones: A Bay Area Investor's Guide to 2026
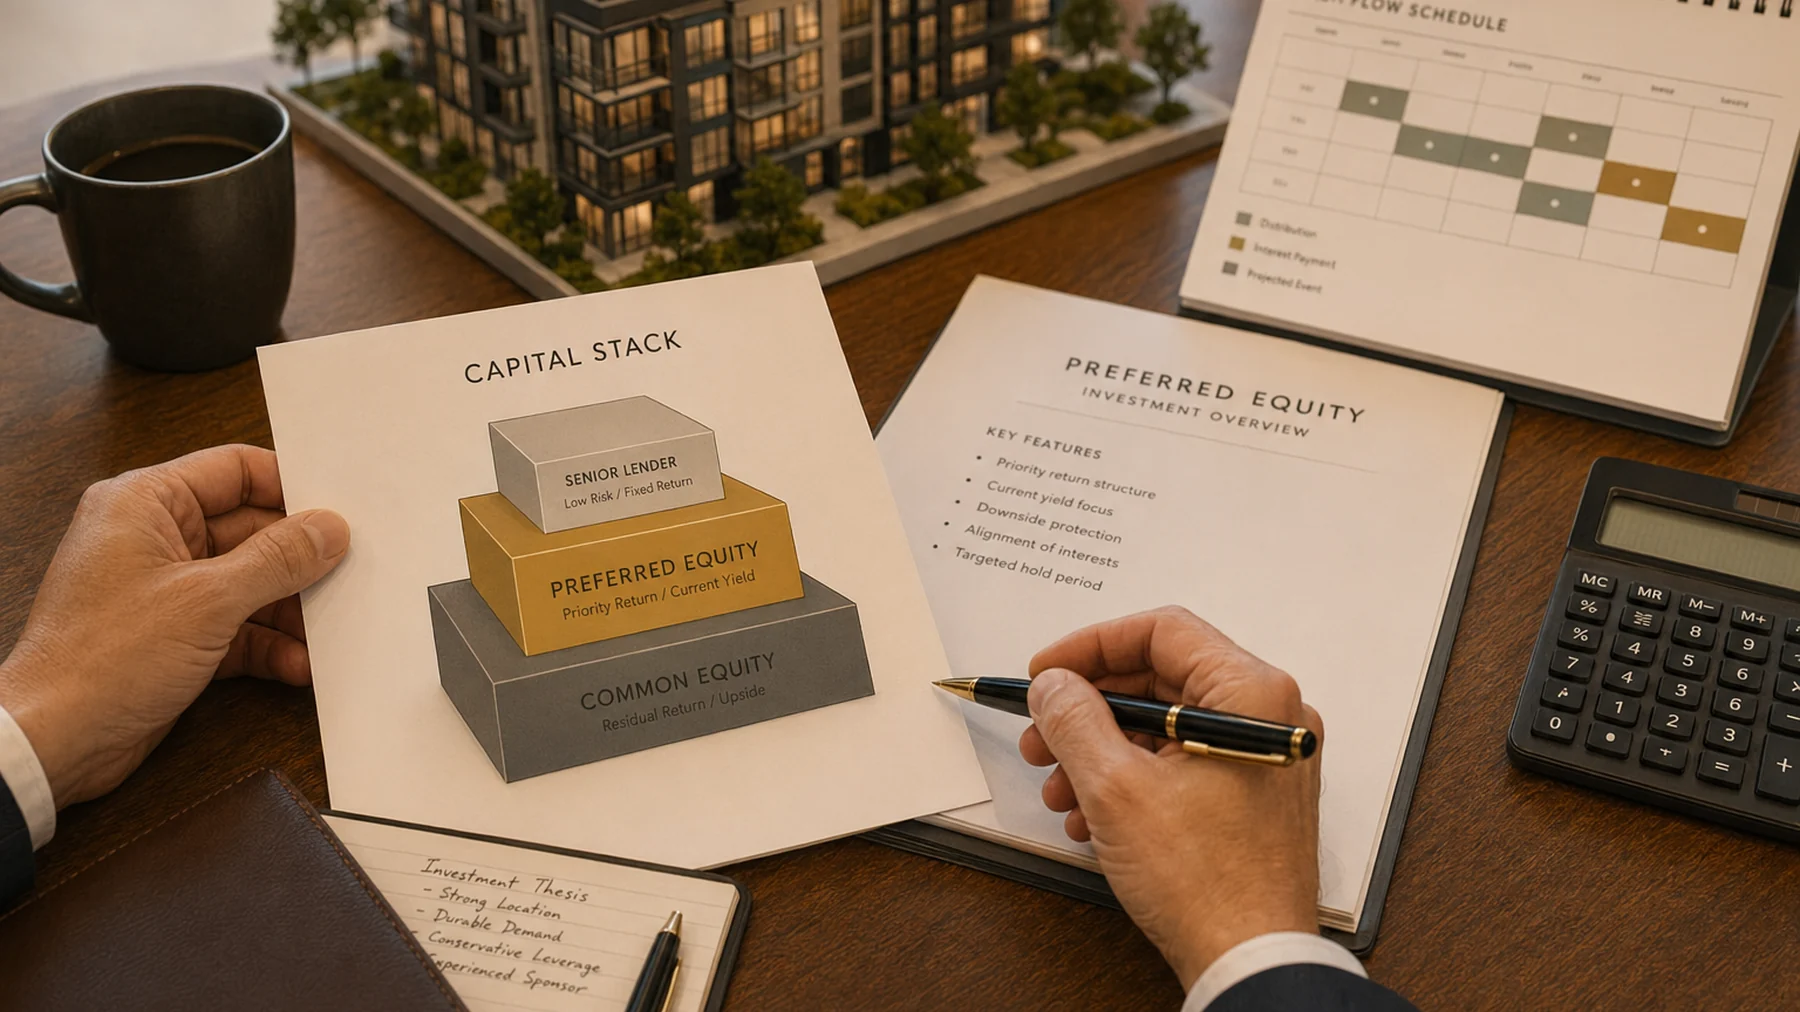
Preferred Equity vs Common Equity in Senior Living Syndications
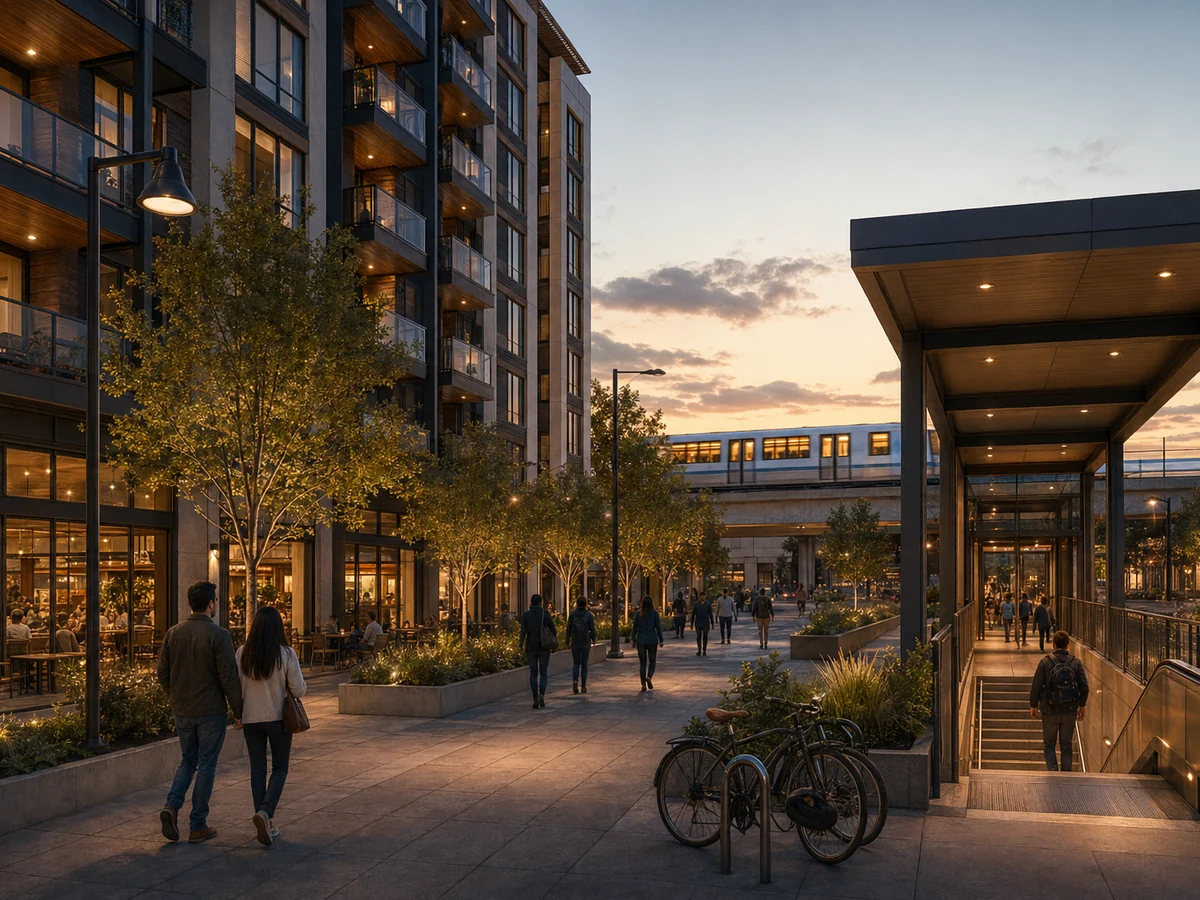
Why Fremont's BART-Adjacent Development Is Undervalued Right Now
See the Capitol 101 underwriting in detail.
126 luxury apartments plus 14,000 sq ft of retail in downtown Fremont. Project memorandum available to accredited investors on verification.